Project Dashboard Template for Agency & Consulting Project Managers — Tableau .twb with Budget Burn, Unbilled Value, Days Past Due and RAG Rating from Your Own Timesheet Export
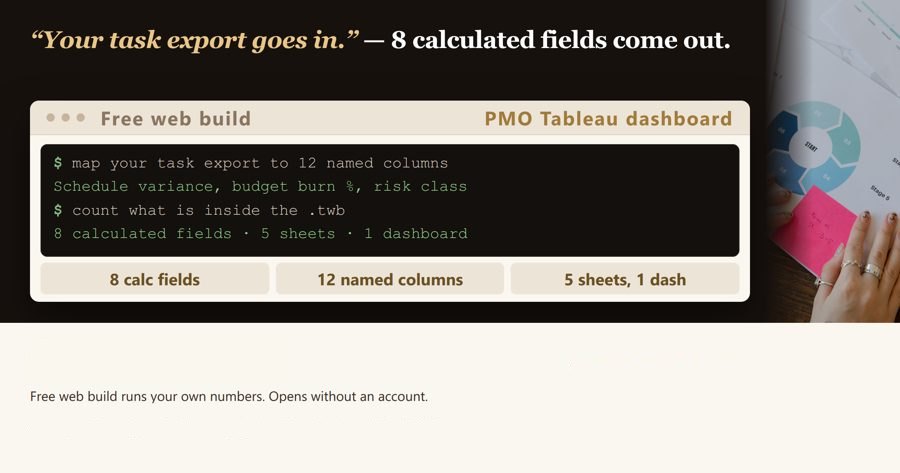
Point it at your own export; 8 calculated fields do the maths.
Point it at your own export; 8 calculated fields do the maths. Budget burn against contracted value, unbilled value, gross margin on your cost rate, days past due, and a red-amber-green rating that only rates live work. Tableau Desktop's free trial runs 14 days — hand-writing these formulas is what eats it. 5 views and 1 dashboard, and the .twb carries no data: it reads the CSV sitting next to it, so the hours you worked but never billed stop hiding inside a 4,000-row export.
Uses: Billable Hours, Billable Rate, Actual Hours, Cost Rate
Days Past Due (finished work against its baseline; live work against today, negative means days still left)
Formula: IF [Status] = 'Complete' THEN DATEDIFF('day', [Planned End Date], [Actual End Date]) ELSE DATEDIFF('day', [Planned End Date], TODAY()) END
Uses: Status, Planned End Date, Actual End Date
Delivery RAG (rates live work only; edit 0.85 to your own amber gate)
Formula: IF [Status] = 'Complete' THEN 'Closed' ELSEIF [Planned Hours] = 0 THEN 'Grey - no baseline' ELSEIF [Actual Hours] > [Planned Hours] THEN 'Red - over hour baseline' ELSEIF [Days Past Due] > 0 THEN 'Red - past due date' ELSEIF [Actual Hours] >= [Planned Hours] * 0.85 THEN 'Amber - 85 percent of hours used' ELSE 'Green - on plan' END
Uses: Status, Planned Hours, Actual Hours
Utilisation Ratio (billable hours over hours actually worked)
Project Name,Client,Project Manager,Status,Planned Start Date,Planned End Date,Actual End Date,Planned Hours,Actual Hours,Billable Hours,Billable Rate,Cost Rate
File you connect: project_time_and_budget.csv
Worksheets (5)
Portfolio RAG Overview
Budget Burn by Project
Days Past Due by Project
Unbilled Value by Client
Delivery Load by Month
Dashboards (1)
Project Portfolio Dashboard
Get the complete version $120
This page is the working piece. The full pack has everything below.
Point it at your own export; 8 calculated fields do the maths. Budget burn against contracted value, unbilled value, gross margin on your cost rate, days past due, and a red-amber-green rati
Two figures you can check before you buy, both published by Tableau itself. Tableau Desktop is offered as a 14-day free trial, and Tableau Public is free with no time limit — so the software is not the cost here, the person who wr
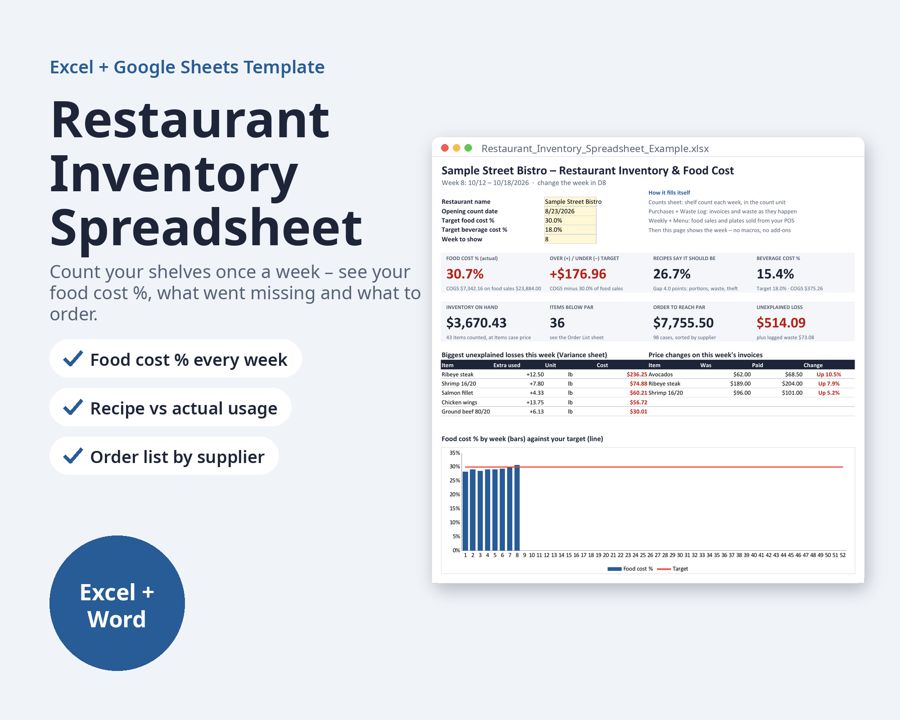 Restaurant Inventory Spreadsheet
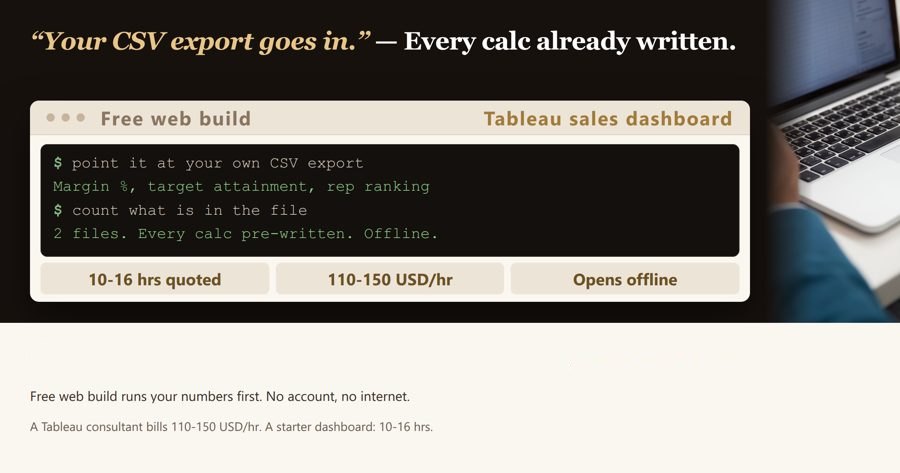 Tableau Sales Dashboard Template — Margin, Target Attainment and Rep Ranking
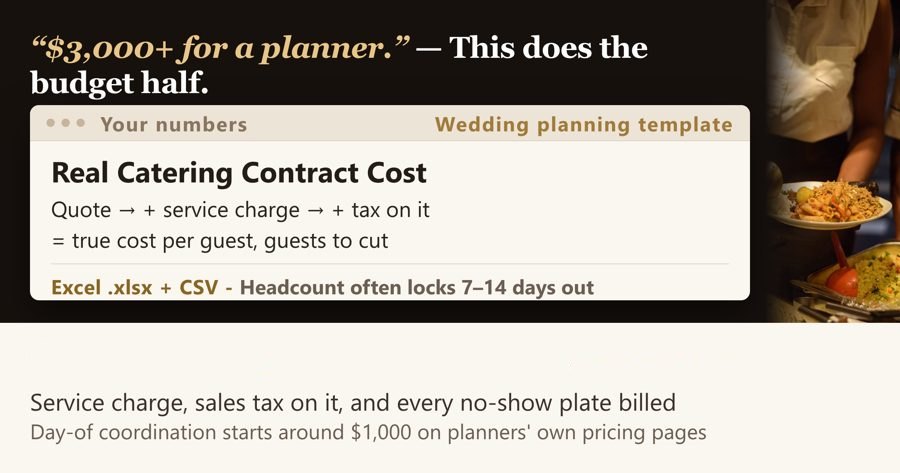 Wedding Planning Template for US Couples Booking a Catered Reception — Guest List, Budget and True Cost per Guest (Excel & Google Sheets; CSV imports into Airtable)
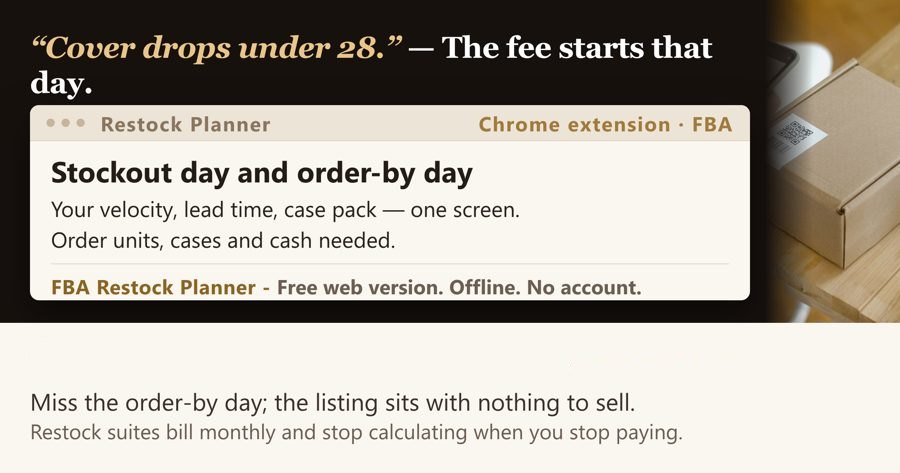 Amazon FBA Profit & Margin Calculator
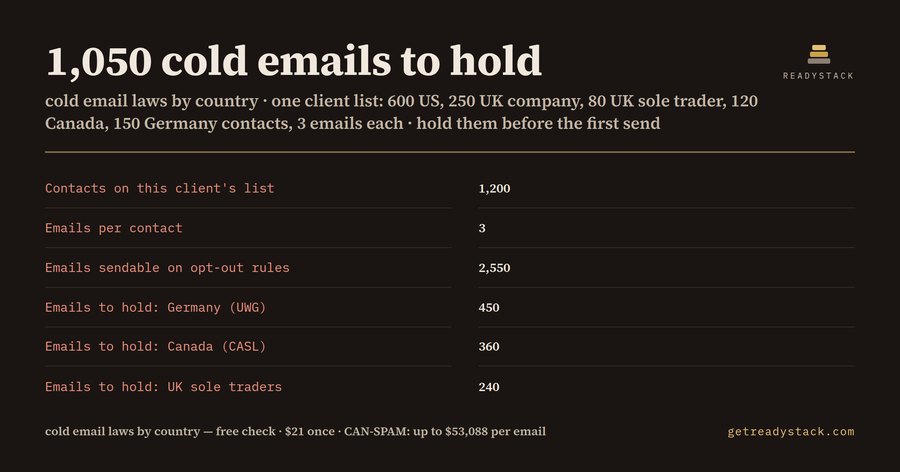 Cold Email Laws by Country: Client List Consent Calculator
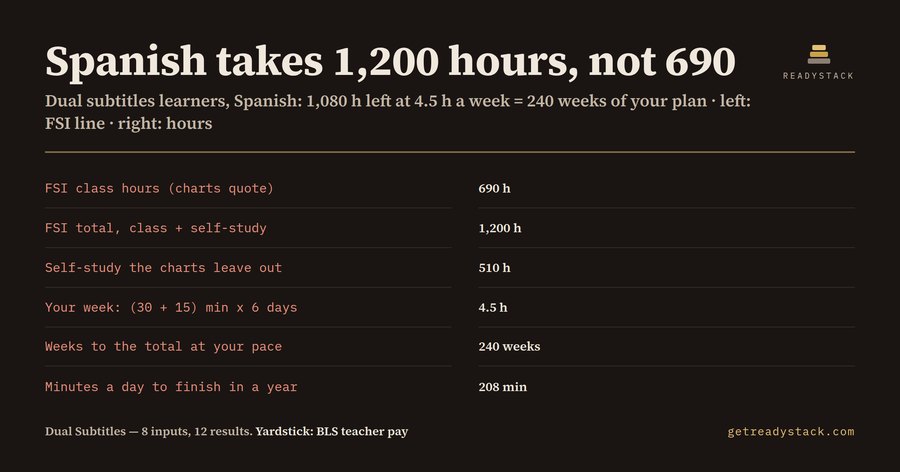 Dual Subtitles Study Hours Calculator: Real FSI Hours