Project Dashboard Template for Tableau — PMO Status, Budget & On-Time KPIs, Bring Your Own CSV
You point it at your own project CSV; 8 calculated fields surface every overdue task and budget overrun before your sponsor sees the steering deck — the ones a raw…
How it works
Read below what is included.
Open the parts you need directly on this page.
A question? Use the question box at the bottom of the page.
You point it at your own project CSV; 8 calculated fields surface every overdue task and budget overrun before your sponsor sees the steering deck — the ones a raw export hides.
Calculated fields included (8)
Schedule Status
Formula: IF [Status] = "Complete" THEN "Done" ELSEIF [Due Date] < TODAY() THEN "Overdue" ELSE "On Track" END
Your team already pays $14 per user/month for Power BI Pro (Microsoft list price effective 1 April 2025) and it still opens on an empty canvas. Point this at your cost report, your P6/MS Pro
This page is the free working part. The full version is sent to your inbox.
Microsoft's published list price is $14 per user/month for Power BI Pro and $24 per user/month for Premium Per User, both effective 1 April 2025. The licence is already bought — what is missing is the model that sits on it. This t
A copy of what you see above, in your inbox — the tool stays free, nothing here is locked.
Questions and answers
What does this page do?
You point it at your own project CSV; 8 calculated fields surface every overdue task and budget overrun before your sponsor sees the steering deck — the ones a raw export hides.
Is it free?
The preview on this page is free.
How do I use it?
1. Read below what is included. 2. Open the parts you need directly on this page. 3. A question? Use the question box at the bottom of the page.
Ask about this tool
One question, answered by the person who built it. Your email only if you want the answer sent.
For a team or company: for an invoice with your company details, a quote or several licences, write to [email protected].
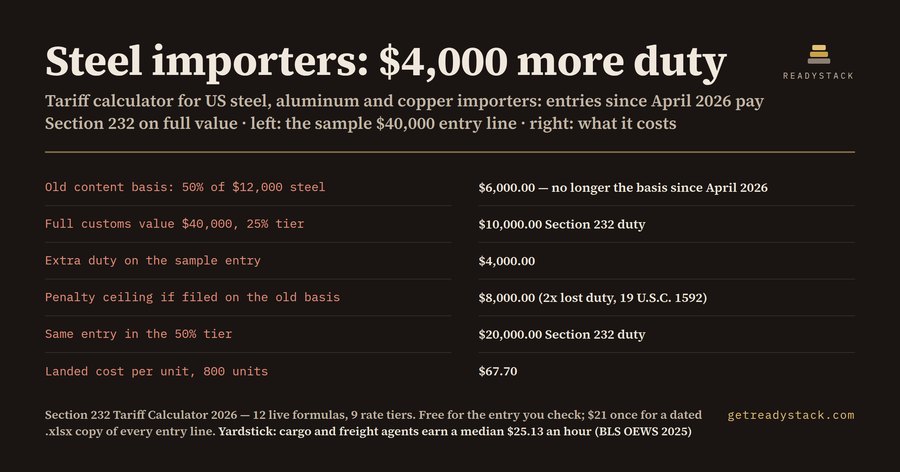 Section 232 Tariff Calculator 2026 — Steel, Aluminum & Copper Duty on Full ValueSince April 6, 2026 the Section 232 duty is charged on the full customs value, not the metal content (Proclamation 11021). Entering on the…FreeFull version $21TikTok Shop Fee Calculator 2026 — 6% vs 8% Referral Fee Profit CheckFor US TikTok Shop sellers: profit per order and per month after the referral fee, creator commission, returns and the refund admin fee.…FreeFull version $21
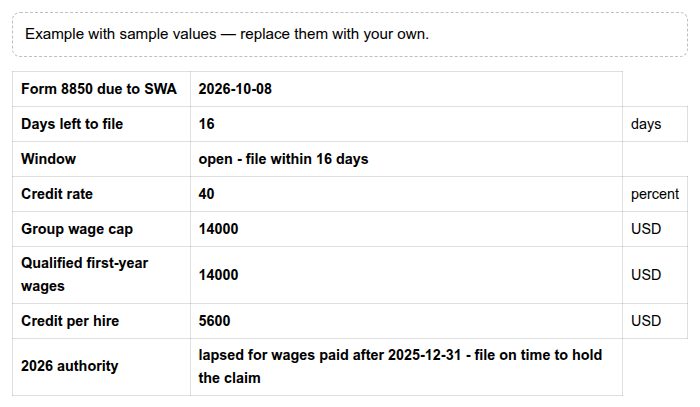 Form 8850 due date and WOTC credit for one hireForm 8850 is due 28 calendar days after a start date. During the 2026 WOTC authority lapse the clock still runs.FreeFull version $60
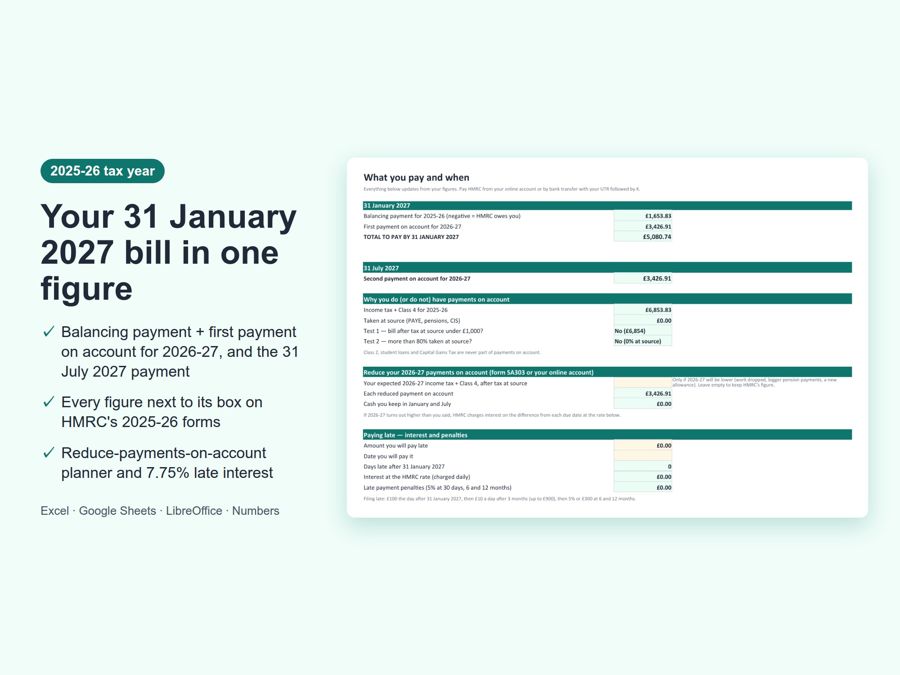 Self Assessment Workbook 2025-26 UK ExcelYour 31 January 2027 Self Assessment bill in one figure — the 2025-26 balancing payment plus your first 2026-27 payment on account — with…FreeFull version $14.99
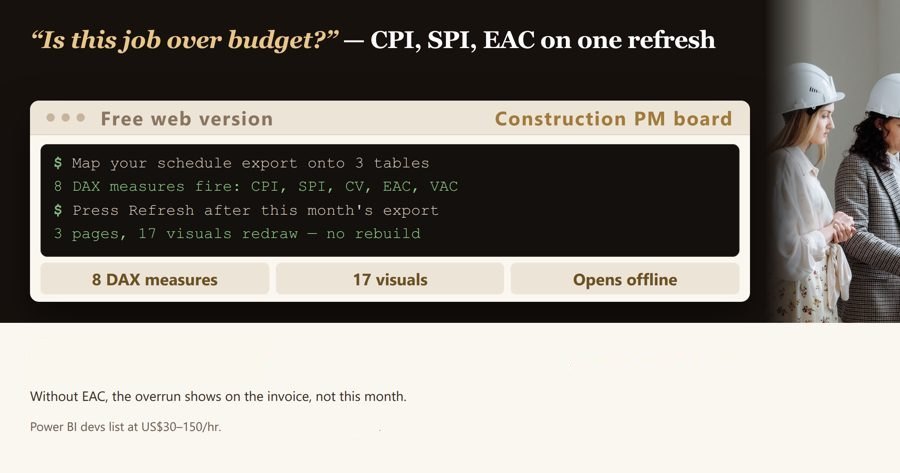 Construction Project Dashboard Template — Earned Value, Float & RFI Control (Power BI)Your team already pays $14 per user/month for Power BI Pro (Microsoft list price effective 1 April 2025) and it still opens on an empty…FreeFull version $69
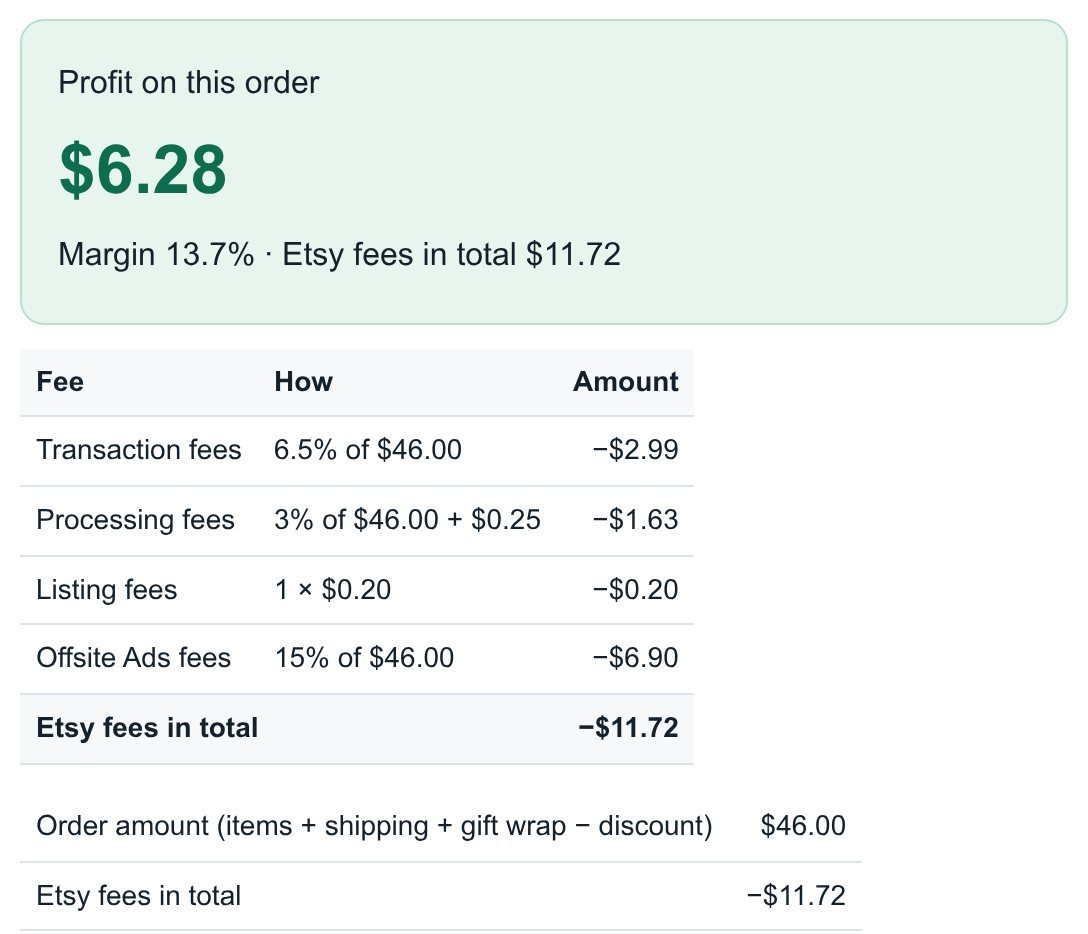 Etsy fee Calculator — Etsy Profit Calculator 2026One sale that Etsy attributes to an Offsite Ad costs 15% of the order total (12% once your shop has sold $10,000 in 365 days), up to $100…FreeFull version $21